Interface
This page explains all settings that can be configured for the Energy Meter. To access the settings, place the block and interact with it to open its user interface. The interface is divided into two sections. The left panel is the global panel and is always visible. The right panel depends on the currently selected tab in the top tab bar.
Global Panel
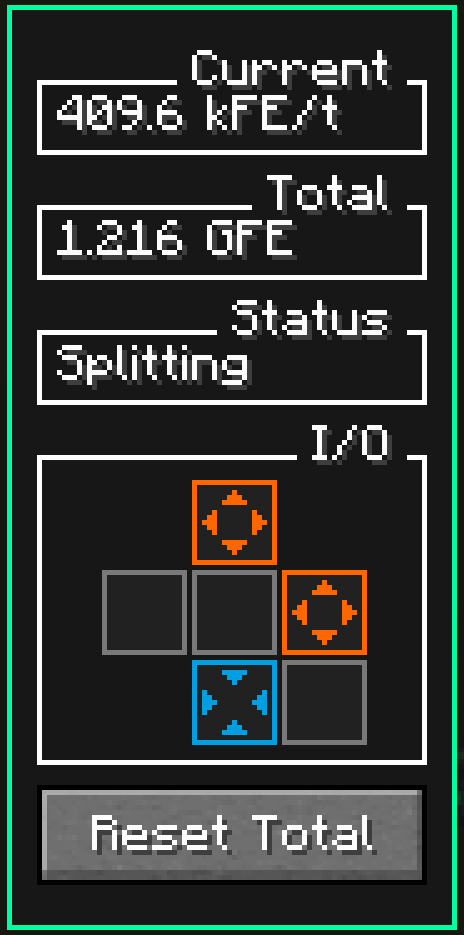
The global panel is located on the left side of the interface. It remains visible even when switching tabs. This panel contains the current measurement values and the status. It also includes the I/O grid and the option to reset the total amount of measured energy.
Measurements
The measurements include the current flow rate and the total amount of measured energy. The total value can be reset using the button below the I/O grid.
The values for the current measurements update once per configured interval. The only exception is reaching the tolerance. See that section for more information.
Status
The status updates whenever a setting or state changes that could affect it. This includes the current flow rate, changes to neighboring blocks, and changes to input and output configurations.
The status Disconnected indicates that the required settings for the currently selected mode have not been configured. In most cases, this means that an input or output is missing. Idle means that all settings are configured correctly and the Energy Meter is waiting to transfer energy. The final status depends on the selected transfer mode and indicates that the Energy Meter is currently processing requests and operating correctly.
I/O Grid
This section is used to configure the sides of the block. Each side can be configured as an input, an output, or disabled for energy requests. The front side cannot be configured because it is reserved for displaying the flow rate on the block. The sides can be configured using left-click or right-click. It is also possible to reset a single side instantly or reset all sides at once. More details can be found in the tooltips of the respective buttons.
Whether a side can be configured as an input or output depends on the selected transfer mode.
Configuration Panel
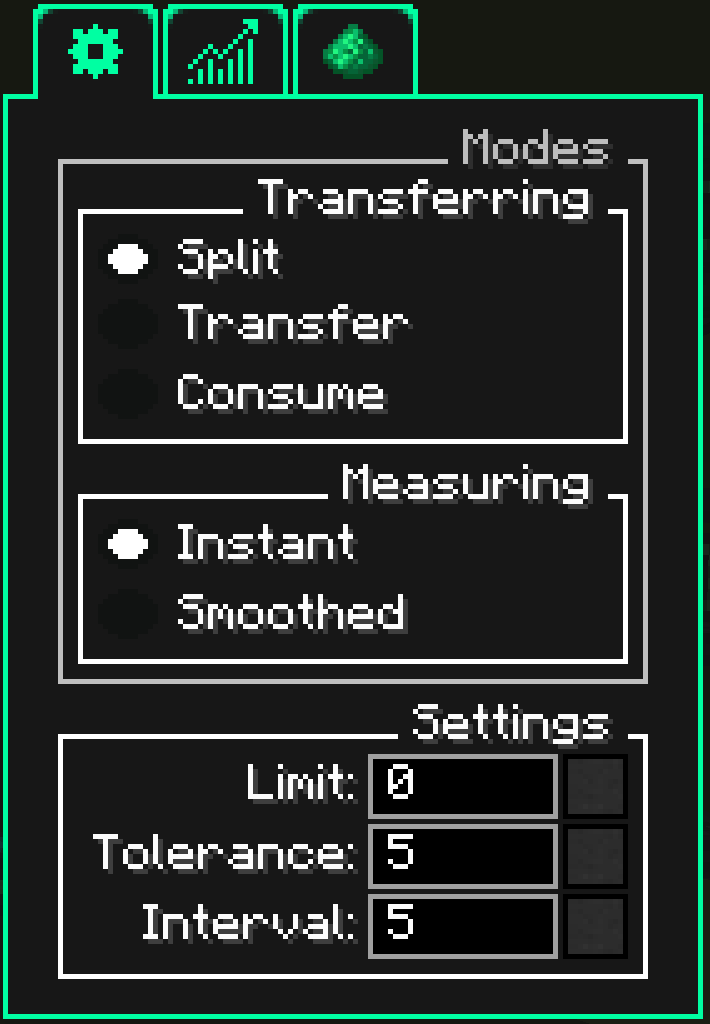
The configuration panel, accessible by selecting the Configuration tab, allows you to adjust settings related to modes and measurements.
Modes
In this section, different modes can be selected using radio buttons. Only one option per section can be selected at a time.
Transferring
The transfer mode determines how energy requests arriving on sides configured as inputs are forwarded to the output sides. The default mode is Split.
In Split mode, incoming requests are distributed evenly across all outputs. The system first attempts to divide the energy equally by the number of outputs so that each output receives the same share. If one of the outputs accepts less than its calculated share, the remaining energy is redistributed to the other outputs. This means the split is not forced. If there are more outputs than available energy, the remainder is sent to a randomly selected output.
The Transfer mode is a special mode. It changes the behavior of the I/O grid and allows priorities to be assigned to outputs. Outputs with higher priority always receive forwarded energy first. The energy is then forwarded in descending priority order. Lower-priority outputs only receive energy if higher-priority outputs cannot accept all available energy.
The Consume mode is used for testing setups. Instead of forwarding energy, this mode permanently deletes all incoming energy. This mode also changes the behavior of the I/O grid by disallowing outputs. It is typically used to measure how much energy can enter through all inputs, especially when the normal flow is limited by the outputs.
Measuring
The measuring mode determines how the flow rate for an interval is calculated. The default mode is Instant.
In Instant mode, only the stored values measured during the current interval are considered. Previous intervals are ignored. This mode is useful when exact values are required.
The Smoothed mode changes the calculation by incorporating the previous interval. Instead of using only the measurements of the current interval, the flow rate is adjusted using the previous interval. This produces a smoother graph and reduces the impact of sudden spikes in the flow rate. This mode is useful for observing average behavior over longer periods.
Settings
The options in this section are text fields that modify certain Energy Meter settings that affect measurement and energy flow. These text boxes also have several special behaviors.
By default, the fields always display the current value. While editing a value, the displayed value does not update. Instead, the button on the right side becomes active. Pressing this button applies the entered value. Alternatively, the modified value can be confirmed using the Enter key.
The text boxes also support several smart features, including input validation. If an input is invalid, for example due to an invalid number, the box turns red and the value cannot be applied.
All text boxes also support mathematical expressions. Supported operations include addition, subtraction, multiplication, division, exponentiation, and parentheses. If a mathematical expression is detected, the text box displays a small popup with the calculated result that can be applied. Since all configurable values are integers, results from mathematical expressions are automatically rounded to the nearest whole number. Invalid symbols are also prevented while entering mathematical expressions. For example, closing parentheses can only be inserted if a matching opening parenthesis exists.
Limit
The transfer limit defines how much energy the Energy Meter can transfer per tick (1 second = 20 ticks). All inputs are accumulated and limited by this value. The limit therefore applies globally and not per input. Any energy exceeding the limit is returned to the sender.
Interval
The interval defines the time in ticks (1 second = 20 ticks) after which a new measurement is performed. During an interval, all relevant values are internally recorded and stored. Once the interval ends, these values are used to calculate the current flow rate and update the total measured energy.
By default, this value is 5 ticks (0.25 seconds). This default can be changed in the mod configuration. For performance reasons, the value can never be lower than 5 ticks.
The relatively small default value allows the Energy Meter to react quickly to changes. This is especially helpful when you want to immediately see when an energy supply is interrupted. However, this can cause fluctuating values to produce a changing average. Increasing the interval can smooth out fluctuations but results in less frequent updates of the flow rate.
Tolerance
Tolerance is a niche option and is rarely required. It is an additional option that refines the interval and defines how many ticks (1 second = 20 ticks) the energy rate may remain zero before the interval resets.
During an interval, the energy supply may temporarily stop. In that case, the flow rate is only set to zero once the entire interval has elapsed. This makes it difficult to detect interruptions when long intervals are used. By default, tolerance is 5 ticks (0.25 seconds). This means it is acceptable for the energy flow through the Energy Meter to be zero for up to 5 ticks. If no energy is transferred on the 6th tick, the interval ends early. This option is therefore only useful when the interval is greater than 5 ticks.
The tolerance value is inclusive. With a value of 5, it is acceptable for energy to be absent for 5 ticks. Only the 6th tick resets the interval.
This option is useful for very long intervals where you want to detect a loss of energy flow early. For example, if the interval is set to 400 ticks (20 seconds), it may be useful to set the tolerance to 50 ticks (2.5 seconds). This would allow you to detect a power interruption after only 2.5 seconds instead of up to 20 seconds. This is particularly helpful when using the Smoothed measurement mode, since the flow rate takes longer to reach zero in that mode.
Graph Panel
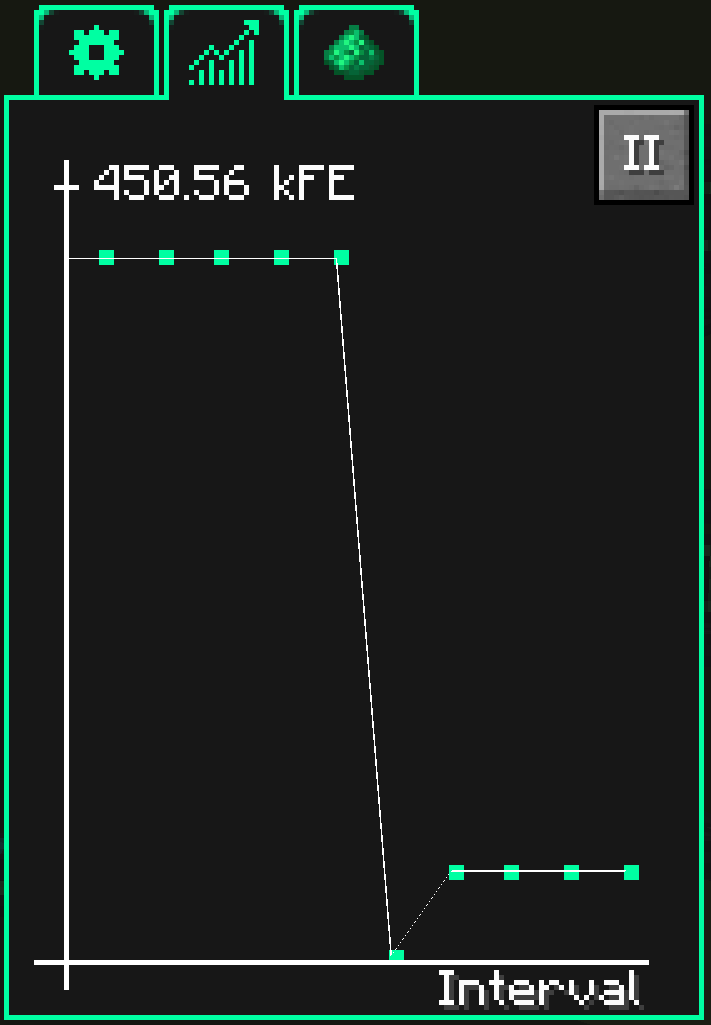
The graph panel can be accessed by selecting the Graph tab. It displays a graphical representation of the last 10 intervals.
The data is shown in a simple coordinate system. The x-axis represents the most recent intervals, while the y-axis shows the average flow rate of each interval. The maximum value of the y-axis is always 10% higher than the largest interval value to make the graph points easier to interpret.
If data for fewer than 10 intervals exists, only the available intervals are displayed. While the current interval is running, only a horizontal line is shown. The graph point appears once the interval result becomes available.
To inspect the data more easily, the graph can be paused using the button in the upper-right corner. Pausing only stops the graphical representation of the graph. Internally, new data is still processed and the Energy Meter continues operating. A label inside the graph indicates that it is paused. Press the button again to resume the graph.
Redstone Panel
The Redstone panel is currently still under development and does not yet contain any options.